
Tom Seaver, 1978
December 11, 2008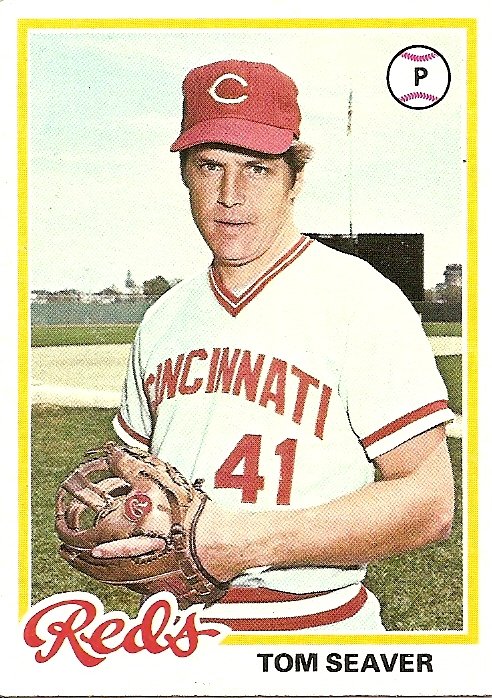
“There is actually a good argument that Tom Seaver should be regarded as the greatest pitcher of all time.” – Bill James
I.
Later, I’ll get to the look on the face of the player pictured here, but first I want to talk about the notion—or is it an unassailable fact?—that we are coming to an end of just about the greatest era for elite pitchers that baseball has ever seen.
Degrees of greatness are difficult to define, but baseball analysts have approached these kinds of definitions by devising ways to adjust raw data for different conditions in different eras. The most effective single statistic of this kind, for pitchers, is ERA+. While ERA+ cannot tell the whole story of a pitcher, it seems to do a better job of it than any other single statistic.
Four of the top ten seasons in ERA+ were recorded between the years of 1994 and 2000. Fourteen of the top 52 seasons in ERA+ were recorded between the years 1990 and 2005. By comparison, only three top-52 seasons occurred during a similar span of years directly preceding this recent era, only three in the fifteen years before that, and just two in the fifteen years before that. You have to go all the way back to the deadball era, an era so slanted toward the pitcher that even ERA+ seems unable to adequately adjust for it, to find a similar explosion of otherworldy pitching seasons, as defined by ERA+. Discounting the deadball era, you are left to conclude that, in terms of elite pitching performances, the era we all had the pleasure of recently witnessing was about three times as magnificent as any era preceding it. Three times as magnificent?
Something seems fishy here.
II.
I’m not the person to be making this inquiry into the numbers.
First of all, I don’t know how to make a graph. A graph showing the recent stark jump in the number of astounding single seasons in ERA+ would do a nice job of illustrating the idea that something went wacky in the machine, that some element of ERA+ may not have been able to adjust to all the conditions and factors producing the raw data of the recent era.
Second of all, and more importantly, I’m not so good with numbers.
If you had told me when I was a kid that I’d grow up to make such an admission, I’d have been surprised. Throughout my baseball-card loving childhood, I loved numbers. This is what the backs of baseball cards were all about, after all: numbers. Stacks of numbers, numbers that swelled and waned like the tide, numbers that gleamed, numbers that wheezed, clownish laughable numbers, awe-inspiring numbers, numbers that seemed to tell stories clearer than anything else in the world I was just beginning to wake up to, ambiguous, slippery, forever uncertain.
The 1978 card shown at the top of this page brought to a close what was perhaps the most magnetic running saga-told-in-numbers of my childhood, for the year before this card came out, while being traded from the Mets to the Reds, Tom Seaver fell four strikeouts shy of 200, the first time in a decade he had failed to surpass that plateau. On first glance at the back of the card, it seems he has fallen well short of 200 not once but twice, since there are two lines of statistics for the 1977 season, one for the Mets and one for the Reds. Once that initial disappointment passes, there is the secondary disappointment of adding his strikeout totals for the two teams together, putting those fourth-grade math skills to use, almost but not quite getting to 200. All things must come to an end. Yet still, above those two sums that don’t quite add up to a hundred, there is that pillar of 200s, nothing quite like it in all the world of the Cardboard Gods. Nobody hit over 40 home runs every year, or even over 30, not even Hank Aaron. Nobody drove in over 100 runs every year. But Tom Seaver struck out over 200 every year, again and again and again. But words don’t do the feat justice. You have to have been a kid, holding one of his baseball cards in your hands, looking at that invincible ladder that stretched all the way back to the beginning of time, i.e., to the year you were born.
As I grew up, numbers began to overpower me. Coincidentally or not, at the same time I started reaching for inebriating substances of one sort or another, as if my inability to any longer make sense of the world by using numbers produced a need in me to become as senseless as possible.
I still remember my trigonometry final exam my junior year at boarding school. It was part of a giant testing period for many classes in the gym. After looking over the test, which repelled me like a force field, I spent most of the time until the bell writing an apology to my teacher in one of those blue examination booklets. It may as well have been my suicide note to the world of numbers. Right around that time, a senior drove up over the border, to Vermont (my school was in western Massachusetts), where the drinking age was still 18, and bought so many bottles of booze that when he got back we spread them out on a kid’s bed and took a picture of them. So many bottles you couldn’t even count them all. The giddiness was palpable. We were about to blast all the numbers clean out of our heads.
III.
So was there some weird warp in history that spit out over three times the amount of great pitchers in one era than in the eras preceding it for the previous seventy years? Over three times the amount?
Or is there some flaw in the ERA+ statistic, some nuance that hasn’t yet been accounted for?
I don’t know, man. Let’s face it, I’m way over my head. In fact, this post is more than anything an invitation to one and all to throw a math-dufus a lifeline.
My one thought, and probably it’s elsewhere either been better expressed or eloquently discounted, or both, is that maybe the staggering ERA+ numbers of Pedro and Maddux and Randy Johnson and Clemens and even Kevin Brown (numbers that seem to argue for the superiority of all these pitchers save the last one over such standouts from previous eras as Tom Seaver) have something to do with the expansion of the league during that time.
This explanation has often been used to hypothesize about the reasons for the ballooning numbers of hitters. Talent is thinned out, allowing star hitters to shine all the brighter by all the fat, inexpertly thrown pitches and by comparison to all the lesser batters allowed by expansion to enter into the league. But for some reason this very same line of thinking has not been used, at least not commonly, to try to explain the outrageously good numbers of some pitchers during the 1990s and early 2000s. I don’t see why not. If the town you grew up in suddenly added several more little league teams, wouldn’t the burly early-puberty kids with armpit hair not only hit more home runs but, when on the mound, garner more strikeouts and scoreless innings? And wouldn’t those pitching numbers look even more breathtakingly dominant when compared to the pitching numbers of a skinny bespectacled feeb forced, because of the thinning of the league’s talent, to leave the safety of deep right field to take repeated tear-laced beatings on the mound?
Some support for this line of thinking is that Randy Johnson, Roger Clemens, Greg Maddux, and Pedro Martinez all had higher career ERAs in the playoffs, where there are fewer skinny bespectacled feebs filling out rosters. (By way of comparison, and this probably means nothing, but Tom Seaver’s career playoff ERA was actually lower than his career regular season ERA.)
IV.
But I don’t know. How can anyone ever be certain of anything?
After all, Tom Seaver was known as the Franchise when he was on the Mets, a nickname that of course ties him to the identity of the team, a nickname that says that if anything in this world is certain, it is that Tom Seaver is the Mets.
And yet, here he is, in a Cincinnati Reds uniform. And not only that, but on the back of the card, his string of 200-strikeout seasons, that towering pillar of numerical certainty, has finally reached its end.
When I got this card I probably gazed for a while at the odd spectacle of the Reds jersey on Tom Seaver, and then I probably gazed for a while at the back of his card, adding two sums to make a number less than 200. Then I probably looked back at the front of the card and stared into Tom Seaver’s eyes.
It doesn’t matter, he is saying. The numbers, the uniform. None of it. What matters, what is certain, is this: Give me the fucking ball and I’ll get you a win.
***
(Love versus Hate update: Tom Seaver’s back-of-the-card “Play Ball” result has been added to the ongoing contest.)


1. In 1984, Rick Sutcliffe won the Cy Young, partly based on the fact that he won 20 games and that he did with two teams.
In 1977, Tom Seaver won 21 games split between two teams and no one really thought that much about it, because Seaver was supposed to win 20 games every year. It would have been a bigger deal if he didn’t.
2. One year the Mets devoted their whole yearbook cover to Seaver sitting behind a desk with seven baseballs, arranged in a figure 7, each with the year and K’s for that season written on them.
To a young fan like me it was like celebrating the mundane: 200 Ks a year was just what Seaver did.
Your last sentence definitely gets to the true essence of Seaver.
3. Stacks of numbers … forever uncertain.
That is a wonderful passage.
4. You forgot an important addendum:
In Love versus Hate, has Tom Seaver’s back-of-the-card “Play Ball” result been added to the ongoing contest?
Seaver in Reds livery will forever look strange to me. I haven’t seen him in a ChiSox uni in years, but I bet that looks stranger still.
5. 4 : Didn’t have time to add it before running for the train, but I’ll get it up there when I get a chance. Thanks a lot for noticing!
6. His face could also have something to do with the fact that this pic is from his first trip to Shea in an opponent’s uniform. The look is almost like, “oh you’re shitting me, Topps photogs are here? All right, pose me, shoot it, and move on…” (Weekend of August 20-21, 1977)
7. There are a lot more pitchers today.
-More teams from expansion.
-A 5 man starting rotation as opposed to 4.
-Larger bullpen staff. Set-up men, closers, one batter specialists (Gramm Lloyd types), plus the usual middle relievers and mop up men.
I am working off of memory here, but
the best analogy I have heard involves two students. One is an A student at a private school, where the median grade is a B minus. The other is an A student at a larger public school where the median grade is a C minus. He gets the A grade despite studying less than the private school student.
That doesn’t mean that the public school student is smarter.
8. I had thought ERA+ adjusted for a wide distribution of data, but maybe not.
Somehow, I had never paid much attention to Tom Seaver as a kid. Much like the team I grew up watching, the Red Sox of the ’70s, pitchers were largely an afterthought, the Washington Generals for the hitters. I do remember what a shockwave Seaver’s trade to the Reds was, however.
9. I’m gonna chime in again, because I can’t help but do so whenever Seaver is the topic.
Despite all the great numbers — and by the way, he should have won the Cy Young in 1981, when his 14-2 record (7-1 in each half season) surpassed Fernando’s 13-7 (8-0, 5-7), and he only lost because Dick Young kept him off the ballot altogether — the Franchise had that hard-to-define quality, a mix of consistency, leadership, drive, and other intangibles that cannot be quantified in any statistics.
He’s the guy you want out there when it’s all on the line. His fastball wasn’t the fastest, others have more career wins and career strikeouts, but they don’t have those things that made George Thomas among the best of all time, ahead of the more current batch mentioned above.
Not that it’s the best measuring stick, but there’s a reason why he has the highest percentage of first-ballot Hall of Fame votes. (Interestingly, his onetime teammate, Nolan Ryan, is second.)
10. I love this essay, but feel compelled to point out that baseball added six expansion teams during Seaver’s career and only four teams during the careers of The Big Four.
I don’t see expansion/dilution of talent as a convincing explanation, particularly in light of the fact that the population pool baseball was drawing from expanded vastly between Seaver’s era and today. It seems to me a grasping-at-straws argument to explain something which to so many people older than me seems counterintuitive–namely, that any cold, hard evaluation of the numbers inevitably leads to the conclusion that Johnson, Pedro, Maddux and Clemens were all better pitchers than Seaver.
11. Good points, all, Eric! I wouldn’t have realized all the expansion in Seaver’s career. I remember somebody breaking down the baseball players per 100,000 at the turn of the last century compared to now, and I don’t remember the particulars but I do remember it validated what you’re saying. I grew incredibly tired of hearing about Mickey Mantle and the supposed golden age of the ’50s when I was a kid.
12. The expansion of bullpens has increased the spread of talent among pitchers. This makes it easier for the top ones to post superior ERAs relative to their league.
If you adjust for this, using a method that Dan Rosenheck developed, Roger Clemens still has 10 of the top pitching seasons of the last 40 years. Randy Johnson has 8. Maddux has 6. Pedro has 4. So does Seaver. FWIW, I’m using top 100 seasons because it’s an easy thing for me to figure out.
13. 10 : Bah! When I was a kid I had to walk ten miles to school in the snow, both ways, uphill each way.
More seriously, I just have to take other people’s word for it when they start talking about cold, hard evaluation of the numbers. I’m incapable of it myself–ain’t got the brains.
But I still think it’s a little fishy that there have been so many seasons of recent vintage that according to the cold hard numbers as they are currently understood rank among the best ever, especially when guys like Kevin Brown and Kevin Appier start showing up in the top 100.
I think the expanded bullpens mentioned in 7 and 12 might explain some of this.
14. I just was noticing how big Tom Seavers left arm looks in this picture. Starting from his forearm, his arm seems to expand into a large grappling hook of a hand by the end. Combine the look on his face and that big arm, I would have no problem giving him the “fucking ball” as you say. I wouldn’t be surprised to see Tom Seaver grab and toss some opposing batter clear over the center field wall or maybe into his mouth. I love this card. Great post dude!
15. The talent pool hasn’t expanded so much as it has shifted! Foreign born players on the AllStar team 1968-1973.
Cedeno, Aparicio, Millan, Sanguillen, Clemente,Marichal,Cuellar,Cardenas,Oliva,Rojas,Alomar,Tony Perez,Carty,Alou,Rodriguez,Tiant,Campaneris,Santiago,Javier,
Cepeda,Carew,Casanova, Concepcion
16. As a lifelong baseball fan who always cared more about the sociological aspects of the game rather than the overload of increasingly obscure statistical formulas, I am proud to say that I really had no idea what “ERA+” was before reading this post.
Of course statistics are the Mama Loshen of the National Pastime, but sometimes the motherlode of over-analytic stats just sucks the fun right out of the whole thing for me. Ditto the numerical mirror-image of the emphasis placed on salary amounts, contractual incentives, $$$, etc. etc. etc.
I still cling to the stat demarcations that I grew up with, ie. the basic ones on the backs of the cards. You can throw “OPS+” and “WHIP” and “AIR” at me till the cows come home, but what I still like about baseball are the stories, the human angle, the threads between the lines. The things that “Cardboard Gods” celebrates best.
I remember well the Yearbook cover described by 4_. A classic….
If I’m sure of any one thing at my rapidly advancing age, it’s that my childhood definitively came crashing to a stupefying end the June day the Mets traded Seaver away.
And if I’m sure of another, it’s that Tom Terriffic was indeed “The Franchise,” and truly was one of a kind.
And that’s something you can bet all your “DIPS” and “BABIP”s and confounding acronyms of the future on.
I mean it.
17. As a lifelong baseball fan who always cared more about the sociological aspects of the game rather than the overload of increasingly obscure statistical formulas, I am proud to say that I really had no idea what “ERA+” was before reading this post.
Of course statistics are the Mama Loshen of the National Pastime, but sometimes the motherlode of over-analytic stats just sucks the fun right out of the whole thing for me. Ditto the numerical mirror-image of the emphasis placed on salary amounts, contractual incentives, $$$, etc. etc. etc.
I still cling to the stat demarcations that I grew up with, ie. the basic ones on the backs of the cards. You can throw “OPS+” and “WHIP” and “AIR” at me till the cows come home, but what I still like about baseball are the stories, the human angle, the threads between the lines. The things that “Cardboard Gods” celebrates best.
I remember well the Yearbook cover described by 4_. A classic….
If I’m sure of any one thing at my rapidly advancing age, it’s that my childhood definitively came crashing to a stupefying end the June day the Mets traded Seaver away.
And if I’m sure of another, it’s that Tom Terriffic was indeed “The Franchise,” and truly was one of a kind.
And that’s something you can bet all your “DIPS” and “BABIP”s and confounding acronyms of the future on.
I mean it.
18. 9
Despite all the great numbers — and by the way, he should have won the Cy Young in 1981, when his 14-2 record (7-1 in each half season) surpassed Fernando’s 13-7 (8-0, 5-7), and he only lost because Dick Young kept him off the ballot altogether
Here are the voting results from 1981:
Fernando: 70 total points
Seaver: 67
Carlton: 50
Ryan: 28
Sutter: 1
Points are given on a 5-3-1 basis. Leaving someone off the ballot isn’t as meaningful as an MVP vote (ranked to 10th place). If Young would have had Seaver 3rd (and I couldn’t find the breakdowns other than 1st place votes), Seaver still would have lost.
I will concede that Seaver probably had the better year.
19. 16 17 Enjoying the numbers and enjoying the stories do not have to be mutually exclusive. One can do both equally, or choose to favor one over the other.
I think the key point to remember is that ERA+ is a relative statistic within a confined period only. It compares how much better Player A was than his peers versus how much better Player B was than his peers. It does not really tell us how much better Player A was than Player B. For example, if Jeff Weaver pitched for a high school team and we calculated his ERA+ for that league, it would likely be much higher than Johan Santana’s ERA+. While that’s an extreme and absurd example, it does make the point. Also, not only can ERA+ be a little tricky in terms of cross-era comparisons, but in eras when there is such a disparity between leagues (like this one), it can be difficult to compare within the same year.
Having said all that, ERA+ is still a very valuable tool because, though flawed, it still is a lot more accurate than simply comparing raw numbers. Also, it does provide us with a definitive calculation of how one performed against his peers. That calculation can then be compared across eras to answer the question of who was more dominant in his time. Maybe that’s not the same as who was better, but then again, it could be. After all, does it matter what Koufax could have done in the year 2000? That’s purely theoretical. Instead of trying to compare what we don’t know, it makes much more sense to go with what we do. Where the numbers don’t seem to jive, we can supplement them with the evaluations of first hand participants and observers (i.e., I’ve heard enough people rave about the super human ability of Koufax, that I can accept ERA+ doesn’t full capture his dominance).
As for why I think more pitchers have posted superior ERA+ totals over the last 20 years, well, I think it has to do with a whole myriad of factors that have made the modern era a hitters league. From steroids to better equipment and training to smaller ball parks to night baseball with superior lighting, etc., most changes in the game have favored the hitter. Then, when you consider the penchant for better athletes to play other sports (it usually requires more athleticism to pitch than hit), more prospects to be steered toward a position (perceived value of 162 games versus 35) as well as the expansion of bullpen usage (talented pitchers throwing fewer innings…or, how good would Papelbon, Rivera, etc. be as starters, thereby lowering the league average ERA and the baseline for ERA+ along with it), all the roads point toward concentration at the top level. Think of it this way: if the pitcher’s mound was 100 feet away (a factor favoring offense), a much smaller percentage of pitchers could differentiate themselves from the pack. Conversely, if the mound was moved to 5 feet away, you, I and everyone reading could probably throw a perfect game. Under what conditions would you expect higher ERA+ readings?
I am sure there are similar reasons for why the deadball era produced a disproportionate number of higher ERA+ readings. I am not as familiar with the intricacies of that era, but there must have been factors that led to a concentration of top pitching talent. The infancy of the talent pool might be the best reason for that.
20. 19 “Enjoying the numbers and enjoying the stories do not have to be mutually exclusive. One can do both equally.”
Exactly. I treasure both approaches, and I think they complement each other. It’s a common crutch of those who don’t like stats to imply that those who do like them don’t understand the human element. That’s hooey.
15 A similar list for the past six years would have about three times as many names, wouldn’t it?
21. Did Leonard Koppett invent the term “deadball era”? I just did a ProQuest search and the first time that it showed up was in a 1968 column by him.
22. 16 : Nicely said, Pete. I have more interest in the numbers than you, or in reading readable essays (by guys like Rob Neyer and Bill James who know how to tell the story, too) about the numbers. The numbers themselves confuse me, beyond the more basic ones.
19 : Thanks for those thoughts. Makes a lot of sense.
21 : Wow, I would have guessed the term had been around before 1968. Interesting. Was it used in ’68 because of the “deadball”-type numbers being put up that year?
23. A New York Times search shows it in use as early as 1946. I think the key is to ditch the compound word and search for “dead ball era.”
24. Thanks, Eric. I wanted to know, but I’m multitasking here. Work’s been keeping me busy since September. I’m even posting less at Primer most days lately.
25. I say to hell with baseball; the old pastime played between chalk lines, by gentlemen in pajamas. Gimme Math!
26. 9 Dick Young did not keep Seaver off the ballot because he thought GTS was not in the top three. Dick kept Tom off because Dick’s son-in-law worked for Mets owner M. Donald Grant in the marketing department, and Grant did not want Seaver to win a Cy Young with Cincinnati, figuring that would be more bad publicity and yet another reason for Mets fans to hate him and maybe stop going to see games at Grant’s Tomb. (Young had been attacking Seaver in the New York press for years.)
I don’t know who Young did vote for, but had he voted for Seaver 2nd, that would have tied Seaver with Valenzuela, only if he had voted for Valenzuela number 1. (Seaver and Fernando both had 8 first-place votes, Carlton 5, Ryan 3.) Had Young voted for Seaver 1st, that would have given Seaver five more points, and maybe fewer for Valenzuela (who might have gone from five points to three points), meaning Seaver would have won the Cy Young.
But forget about the numbers; the main thing is that Dick Young kept Seaver off the ballot for purely personal reasons — and should have had his voting rights taken away immediately.
27. 26 Whoops, I meant to link to 18 .
28. If one is going to argue for human moments over numbers, then there is no candidate for the 1981 Cy Young Award other than Fernando Valenzuela.
29. 20 That’s why I stated that “the talent pool hasn’t expanded so much as it has shifted.” Teams have been scouting Latin America since the 1950’s.
30. My favorite sabernerd, Rob Neyer, chimed in on this entry Friday:
“Josh Wilker wonders what it was about those pitchers of the 1990s that allowed them to post those crazy-low ERA’s relative to their leagues. Were they really that good? And so many of them at the same time? Josh thinks maybe they weren’t, and I’m inclined to agree with him. I don’t think he’s quite figured out the mechanism of those bizarrely brilliant ERA+’s; I don’t think I have, either (though I think I’ve come a little closer than he has). What I really think, though, is that it’s almost certainly not possible that all the best pitchers of the last 50 years just happened to pitch at almost exactly the same time. ”
31. Feller 122, Spahn 118, Petite 117, Oswalt 139,
Tim Hudson 126, Steve Carlton 115, Kevin Appier 121, Tom Seaver 127, Curt Schilling 127, Kevin Brown 127, Bob Gibson 127,Zambrano 128, Koufax 131, Marichal 123, Palmer 126.
Maybe in 20 years or so, they will be able to better evaluate the current era, and notice that there was a difference between Andy Petite and Warren Spahn.
32. 31
since the 1950’s
Is ther a correlation between when the leagues started adding teams – and when the increase in talent coming from outside the US accelerated?
33. 32: Expansion was more a result of the changing demographics in this country. It had more to do with whether a city(market) could support a team.
Also, integration after 1947 had the biggest impact on the talent pool. Look at all the players in the 1950-1970 era that would not have been eligible to play in an earlier era (foreign or US born).