
Nate Colbert
June 24, 2007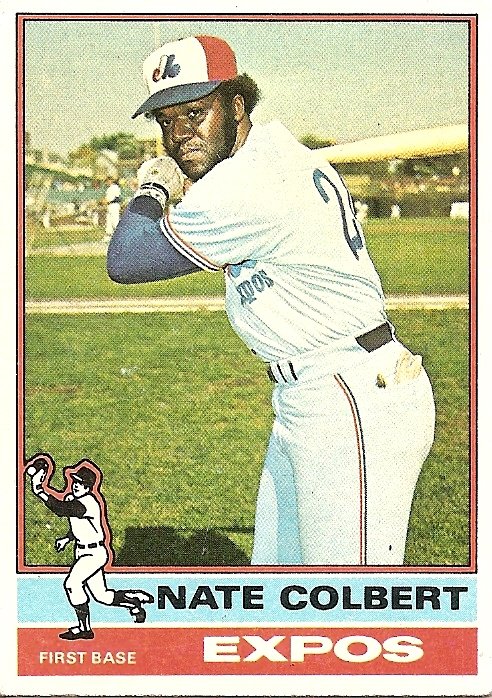
In 1972, Steve Carlton produced the most renowned “man alone” single-season performance in baseball history, winning 27 games for a famously putrid Philadelphia Phillies squad. The team’s record in games not involving Steve Carlton in the decision was 32 and 87, a 44 and 118 won-loss ratio when translated to a 162-game schedule. No pitcher has earned more wins since, and only Bob Welch in 1990, benefiting from the support of a nearly dynastic Oakland A’s squad that reeled off 103 wins that year, won as many. Most feel that Carlton’s 1972 season is among the best ever produced by a pitcher.
The best offensive counterpart to Steve Carlton’s famous 1972 season may have occurred in that very same year: Nate Colbert drove in 111 runs for the San Diego Padres, the only 1972 National League team to score fewer runs and win fewer games than Carlton’s Phillies. Colbert’s RBI total accounted for a whopping 23% of the Padres’ total 488 runs. I don’t know if this is the highest percentage in history, but I did check the ratio of RBI to team runs scored for the top single-season RBI producers in baseball history, finding that single-season leader Hack Wilson drove in 19% of his teams runs in 1930; Lou Gehrig 17% in 1931; Hank Greenberg 20% in 1937; and Jimmie Foxx 19% in 1938. Seeing that the top single-season RBI totals were all produced in the hitter’s paradise of the 1930s, I also scanned farther down on the list of RBI leaders for players from relatively low-scoring eras and checked a few deadball era single season RBI champs for their ratios, too. Then I got tired of the whole task and decided to unscientifically cut to the chase and crown Nate Colbert as the greatest single-season RBI producer in the history of the game. I also feel that he had the greatest pair of muttonchops.
Anyway, here he is late in his 11-year career, looking a little melancholy, as if he knows there are only two more major league home runs left in his bat.


1. So when he played with the Expos, and the local paper did a story about him, was that a Colbert Report?
2. Oui, c’est vrais. Mais Nate Colbert ne frappent pas souvent pour les Expos.
3. By the way, I ran the query you suggested above, and you are correct. Colbert had the highest RBI-to-team runs ratio in MLB history. Here’s the top 50:
ratio rbi r year tm name
—
0.2275 111 488 1972 SDN Nate Colbert
0.2261 130 575 1935 BSN Wally Berger
0.2222 010 045 1875 KEO Charley Jones
0.2125 143 673 1959 CHN Ernie Banks
0.2059 160 777 2001 CHN Sammy Sosa
0.2041 141 691 1961 BAL Jim Gentile
0.2027 075 370 1981 CHN Bill Buckner
0.2025 128 632 1943 CHN Bill Nicholson
0.2023 106 524 1968 WS2 Frank Howard
0.2021 114 564 1919 BOS Babe Ruth
0.2013 126 626 1970 WS2 Frank Howard
0.1996 113 566 1972 CHA Dick Allen
0.1977 120 607 1933 PHI Chuck Klein
0.1960 165 842 1934 NYA Lou Gehrig
0.1957 118 603 1979 SDN Dave Winfield
0.1957 183 935 1937 DET Hank Greenberg
0.1955 138 706 1925 NYA Bob Meusel
0.1953 108 553 1958 WS1 Roy Sievers
0.1952 115 589 1915 PHI Gavvy Cravath
0.1952 154 789 1937 SLN Joe Medwick
0.1940 175 902 1938 BOS Jimmie Foxx
0.1940 090 464 1981 CIN George Foster
0.1934 141 729 1954 CIN Ted Kluszewski
0.1929 104 539 1944 PHI Ron Northey
0.1927 121 628 1952 CHN Hank Sauer
0.1927 116 602 1994 HOU Jeff Bagwell
0.1920 130 677 1963 ML1 Hank Aaron
0.1920 106 552 1933 BSN Wally Berger
0.1914 191 998 1930 CHN Hack Wilson
0.1910 148 775 1970 CIN Johnny Bench
0.1905 096 504 1994 SFN Matt Williams
0.1903 137 720 1987 CHN Andre Dawson
0.1901 158 831 1998 CHN Sammy Sosa
0.1891 114 603 1957 WS1 Roy Sievers
0.1888 141 747 1999 CHN Sammy Sosa
0.1886 112 594 1994 MIN Kirby Puckett
0.1883 145 770 1953 CLE Al Rosen
0.1869 117 626 1955 CHN Ernie Banks
0.1867 118 632 1943 DET Rudy York
0.1865 127 681 1949 PIT Ralph Kiner
0.1863 109 585 1908 PIT Honus Wagner
0.1863 163 875 1933 PHA Jimmie Foxx
0.1858 149 802 1977 CIN George Foster
0.1854 137 739 1971 SLN Joe Torre
0.1854 104 561 1901 CIN Sam Crawford
0.1853 091 491 1981 PHI Mike Schmidt
0.1851 117 632 1989 SLN Pedro Guerrero
0.1850 170 919 1935 DET Hank Greenberg
0.1847 128 693 1913 PHI Gavvy Cravath
0.1846 125 677 1985 CIN Dave Parker
4. Not to hyperextend the other day’s discussion, but Nate Colbert in an Expos uniform was a pretty surprising sight.
I had forgotten he washed up at Parc Jarry for a short time.
Maybe he looks melancholy b/c he knows he will spend virtually his entire career on miserable expansion teams, playing before 5,000 fans a night.
No fin-de-career phone call from the Reds, Dodgers or Yankees for Nate Colbert.
5. Charley Jones! They still don’t know what happened to him after his career. Like One Arm Daily, he may still be haunting some old ballyard somewhere.
6. The 72 Padres of Colbert were 58-95, but Berger’s 1935 Braves were 38-115!
7. 5 The 1875 Keokuk Westerns also produced the Nate Colbert of run scoring: Jimmy Hallinan scored 12 of their 75 runs.
If you exclude the pre-1900 teams, the run scoring ratio king is Burt Shotton of the 1913 St. Louis Browns, at 19.89%. Tim Raines (1983 Expos, 19.65%), and Rickey Henderson (1981 A’s, 19.43%) follow.
8. 7 What a weird schedule the 1875 National Association must have played. The Keokuk Westerns played 13 games (going 1-12) while the Hartford Dark Blues played 82 games and the champion Boston Red Stockings played 79 games. And I thought interleague play made for a bad schedule. I guess they played whenever they could get a crowd to pay the bills in 1875 and that was the schedule. Kind of like the modern day NHL.
9. 3: Thanks for the confirmation, Ken.
4: Colbert did get one extremely brief and inconsequential moment in a pennant race at the very end, making his last 5 outs for the ’76 Oakland A’s, who still had enough fumes in their dynastic tank to make a race of it with the Royals.
10. I just had to go to Retrosheet to look up Colbert’s cup of coffee with the Bicentennial A’s.
On Sept. 6, he started at DH and went 0-for-4 with three strikeouts.
And on October 1, he pinch-hit and stayed in the game at DH, going 0-for-1 with an intentional walk.
What d’ya suppose he did in between?
They couldn’t have sent him DOWN between appearances, could they? The minor-league season would have been over.
Did he patiently come to the ballpark every day, pull on his lurid yellow-and-green double-knits and sit on the bench again and again?
Did he perhaps confess minor muscle soreness to the skipper, only to be mentally written off as unfit and without utility for the rest of his stay?
Did he watch his team rack up wins of 13-3 (Sept. 19) and 11-1 (Sept. 21) and wonder silently why no place could be found for a pinch-hitter or late-inning substitute?
Was he one of those guys who occasionally walked from one end of the dugout to the other, half-swinging a bat, flexing their arms and trying to look relevant?
There’s a book, or at least a novella, in that month.
Heck, maybe a concept album.
11. In 1959, Ernie Banks led the Cubs in RBIs by 91. He had 143, and Bobby Thomson was second with 52.
12. It says something that 10 of those 50 were Cubs.
13. In 1971, on those same dreadful Padres, Enzo Hernandez set a record for futility by knocking in only 12 runs in over 600 plate appearances. He also made 33 errors to boot.